This article is for educational and informational purposes only and is not personalized financial advice. Some links in this article may be affiliate links, meaning LaunchWealthy may earn a commission at no additional cost to you. This does not affect our evaluation.
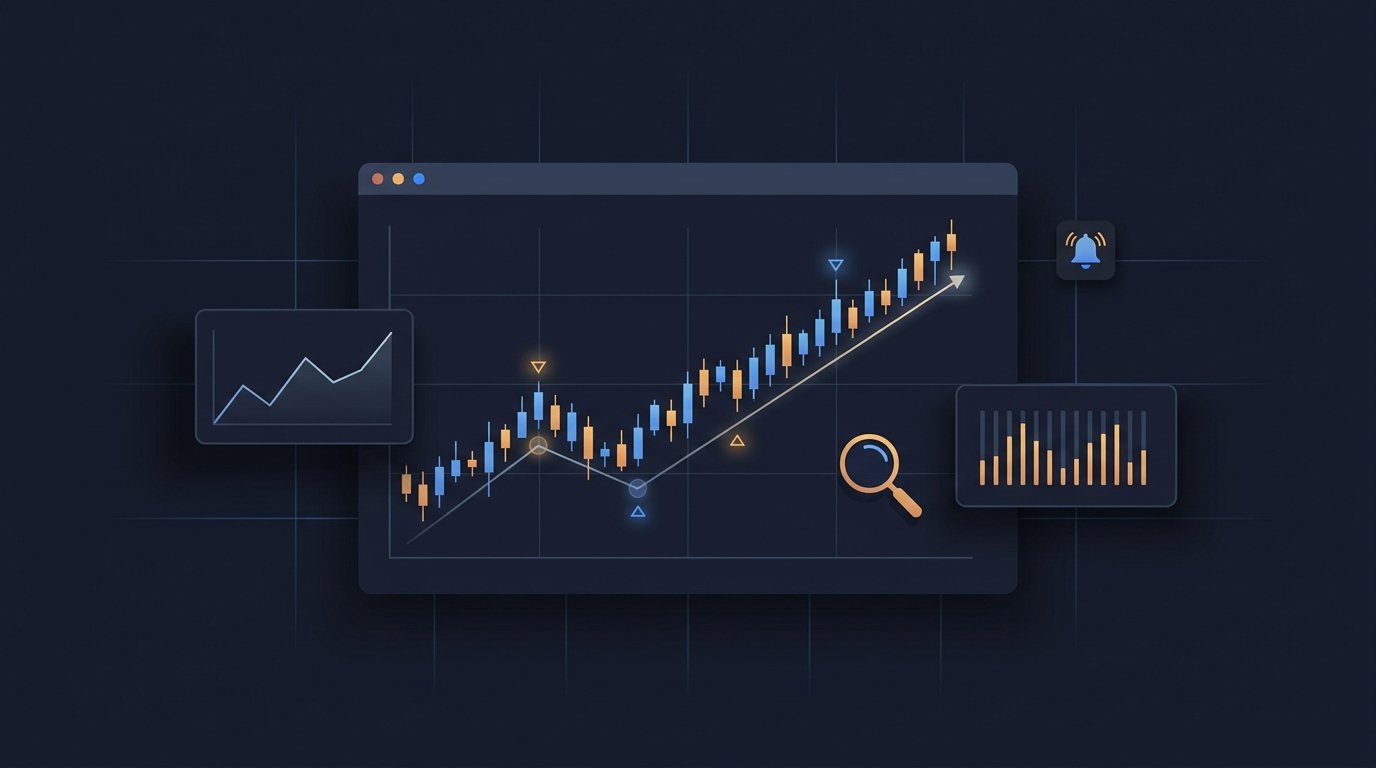
You’ve probably seen a TradingView chart before you even knew what it was called — that clean, dark-mode candlestick chart embedded in finance articles, YouTube videos, and trading forums. Now you’re trying to decide whether it’s actually worth paying for, or whether the free version does enough. This TradingView review 2026 exists to answer exactly that question, using verified current pricing rather than guesswork.
TradingView has become the default charting platform for millions of investors and traders because it combines a genuinely powerful charting engine with a large community of people sharing analysis and custom indicators. But there’s a real gap between casually browsing TradingView’s free charts and paying $15 to $240 a month for one of its subscription tiers. This review examines what each tier actually unlocks, where TradingView excels, where it falls short, and who should — and shouldn’t — pay for it.
Quick Verdict
Overall Rating: 4.4/5
- Best for: Traders and investors who want serious charting and technical analysis tools across stocks, crypto, and forex
- Not ideal for: Passive long-term investors who never look at charts
- Biggest advantage: A charting engine and indicator library that’s genuinely best-in-class, free or paid
- Biggest disadvantage: The jump from Essential to Premium more than quadruples the price for features many casual users won’t use
- Best feature: The sheer depth of the indicator and screener ecosystem
- Best plan for beginners: The free Basic plan, or Essential if alert limits become restrictive
- Value for money: Strong at the free and Essential tiers; the case gets weaker fast unless you’re an active trader
- Final verdict: TradingView is worth it in 2026 for anyone doing regular technical analysis, but most beginners should start free and only upgrade once a specific limit actually gets in the way
1. What Is TradingView?
TradingView is a market analysis and charting platform used by more than 100 million traders and investors worldwide. It’s built around interactive price charts, technical indicators, watchlists, screeners, and a social feed where users publish trading ideas and custom scripts.
It’s important to understand what TradingView is not: it is not a brokerage. You can’t deposit money and buy a stock directly through TradingView the way you would with a broker, although TradingView does support connecting certain third-party brokers for chart-based trade execution. TradingView is a market analysis platform — it helps you study price action, build watchlists, and set alerts, while your actual buying and selling still happens through your broker.
TradingView serves stock investors, ETF investors, cryptocurrency traders, and forex traders, along with more advanced users writing custom indicators in Pine Script. It also includes paper (simulated) trading, letting users practice a strategy without risking real money. Using TradingView doesn’t guarantee better investment results — the platform gives you tools for analysis, not predictions.
2. How Does TradingView Work?
- Create an account — Sign up free with no credit card required.
- Choose free or paid access — Start on the Basic plan, or begin a trial of a paid tier.
- Select a market — Search stocks, ETFs, crypto, forex, indices, or futures.
- Open a chart — Load an interactive candlestick or line chart for the symbol.
- Customize the chart — Adjust timeframes, chart type, and colors.
- Add indicators — Layer on tools like moving averages or RSI, up to your plan’s limit.
- Create watchlists — Group symbols you want to track together.
- Set alerts — Get notified when price or indicator conditions are met.
- Analyze price action — Use drawing tools and multi-timeframe views to study trends.
- Use paper trading if appropriate — Practice a strategy with simulated funds.
- Connect a supported broker if available — Enable chart-based trade execution where supported.
- Track and improve the analysis process — Review past ideas and alerts to refine your approach over time.
3. TradingView Pricing 2026

TradingView pricing 2026 uses a five-tier structure, and the numbers below are verified directly from TradingView’s official pricing page.
| Plan | Price | Best For | Key Features | Main Limitation |
|---|---|---|---|---|
| Basic (Free) | $0 forever | Casual chart browsing and learning the platform | 1 chart, 2 indicators, 3 price alerts, paper trading | Ads shown; very limited chart and alert capacity |
| Essential | $14.95/mo ($12.95/mo billed annually) | Beginners ready to upgrade past Basic’s limits | 2 charts, 5 indicators, 20 price + 20 technical alerts, ad-free | Only 1 saved chart layout; limited simultaneous connections |
| Plus | $34.95/mo ($29.95/mo billed annually) | Active swing traders and technical analysts | 4 charts, 10 indicators, 100+100 alerts, Bar Replay | Watchlist alerts still unavailable |
| Premium | $69.95/mo ($59.95/mo billed annually) | Full-time or active traders | 8 charts, 25 indicators, 400+400 alerts, 2 watchlist alerts | Meaningful jump in price from Plus |
| Ultimate | $239.95/mo ($199.95/mo billed annually) | Professional-level analysts and desks | 16 charts, 50 indicators, 1,000+1,000 alerts, 15 watchlist alerts | Priced well beyond what most individual traders need |
Annual vs. monthly billing: Paying annually saves roughly 13–17% versus monthly billing, and the discount grows in dollar terms at higher tiers. TradingView also runs periodic promotions — most notably around Black Friday and Cyber Monday — offering steep discounts on annual plans; these promotional prices should not be treated as the standard rate.
Exchange data isn’t included. Real-time data for many stock and futures exchanges (NASDAQ, NYSE, CME, and others) is sold separately as an add-on, even on paid plans. Cryptocurrency data is generally provided in real time by default. Users classified as “professional” (registered with a financial regulator or trading for a business) face significantly higher data costs and can only subscribe to the Ultimate plan.
Refunds are available on annual plans only, within 14 days of payment — monthly plans and market data purchases are non-refundable.
Which plan offers the best value?
- Complete beginners: Stay on Basic (free) until a specific limit — usually alert count or chart count — actually becomes restrictive.
- Casual investors: Essential is usually enough for a handful of charts and alerts.
- Serious technical analysts: Plus adds enough indicators and alert capacity to build a real workflow.
- Active traders: Premium’s higher alert and chart-connection limits typically justify the jump.
- Advanced/professional users: Ultimate is built for desks and power users running many simultaneous analyses — it’s overkill for most individuals.
4. TradingView Features
- Advanced charts: Interactive, fast-rendering charts across stocks, crypto, forex, and more — the foundation everything else is built on, and it works well even on the free plan.
- Indicators: Over 400 pre-built indicators plus 100,000+ community-built ones, so almost any analysis approach has existing tooling — though indicator count per chart is capped by plan.
- Drawing tools: 110+ tools for trendlines, Fibonacci retracements, and pattern marking, which matter for anyone doing manual chart analysis rather than relying purely on indicators.
- Multiple timeframes: View the same symbol across different intervals, useful for confirming a trend across both short- and long-term views.
- Watchlists: Track groups of symbols in one place; higher tiers support far more symbols per watchlist and more total watchlists.
- Alerts: Price and technical alerts that notify you when a condition is met, which matters because it reduces the need to watch charts constantly — though free and Essential tiers cap you at a limited number.
- Screener tools: Filter stocks, ETFs, and crypto by fundamental or technical criteria across 150+ exchanges, useful for narrowing a large market down to a shortlist.
- Paper trading: Practice strategies with simulated funds, available across plans, which matters for anyone testing an approach before risking real capital.
- Fundamental data: Financial statements and earnings data displayed directly on charts, with history depth expanding on paid tiers.
- Economic/market data: Economic calendars, earnings calendars, and yield curves, useful for macro-aware traders.
- Community ideas: A social feed of published trading ideas and analysis, useful for learning different approaches, though quality varies widely and nothing published there should be treated as advice.
- Pine Script: TradingView’s own scripting language for building custom indicators and strategies, which matters for advanced users who want tools beyond the built-in library.
- Strategy backtesting: Test a strategy against historical data, with deeper backtesting detail unlocked at higher tiers.
- Multi-chart layouts: View several charts at once, scaling from 1 on Basic to 16 on Ultimate.
- Mobile and desktop apps: Fully synced access across web, desktop, and mobile, useful for monitoring markets away from a computer.
- Broker integrations: Chart-based trade execution through supported third-party brokers.
- AI-related features: TradingView has been rolling out AI-assisted chart tools to help surface patterns and speed up analysis, though these are assistive rather than predictive.
5. TradingView for Beginners
Beginner Difficulty: 4/10
Creating an account and opening your first chart on TradingView is straightforward — the interface is polished and the free plan is genuinely usable for learning. Adding an indicator or drawing a trendline takes a few clicks.
Where beginners hit a wall isn’t the software itself, it’s technical analysis as a discipline. Understanding what an indicator is actually telling you, avoiding indicator overload, and interpreting price action all take real time to learn. TradingView’s simplicity as software doesn’t shortcut the learning curve of investing or trading itself — those are two separate skills, and conflating them is a common beginner mistake.
6. TradingView Pros and Cons

Pros
- Best-in-class charting engine — Fast, responsive charts that remain smooth even with several indicators loaded, which matters for anyone doing detailed technical analysis.
- Massive indicator library — Over 400 built-in tools plus a community library in the hundreds of thousands, covering nearly any analytical approach.
- Genuinely useful free tier — Unlike many platforms, the Basic plan isn’t a crippled demo; it’s a real, usable charting tool.
- Cross-device sync — Layouts and watchlists stay synced across web, desktop, and mobile.
- Built-in paper trading — Lets beginners test strategies without financial risk.
- Active community — A large base of users publishing ideas and custom scripts you can learn from.
- Multi-market coverage — Stocks, crypto, forex, futures, and more in a single platform.
Cons
- Steep price jump between mid and top tiers — Moving from Plus to Premium to Ultimate escalates quickly relative to the added value for most individual users.
- Exchange data sold separately — Real-time data for many stock and futures exchanges costs extra even on paid plans.
- Alert limits on lower tiers — The free and Essential plans cap price and technical alerts fairly low.
- Feature restrictions can feel arbitrary — Some genuinely useful tools (like watchlist alerts) are locked behind Premium.
- Potential information overload — The sheer number of available indicators can overwhelm beginners who haven’t yet developed a focused strategy.
- Professional-status pricing — Users classified as professional face steep additional data costs and lose access to lower tiers entirely.
- Annual-only refunds — Monthly subscribers and anyone buying market data have no refund path if they change their mind.
7. TradingView for Different Users

TradingView for Stock Investors — Excellent
Deep fundamental data, screener tools, and years of historical financials make it a strong fit for anyone researching individual stocks.
TradingView for Crypto Investors — Excellent
Real-time data across most crypto exchanges by default, combined with strong charting, makes this one of TradingView’s strongest use cases.
TradingView for Forex Traders — Good
Solid charting and alert tools, though active forex traders may still want a dedicated execution platform alongside TradingView for analysis.
TradingView for Technical Analysts — Excellent
This is TradingView’s core strength — the indicator depth, drawing tools, and Pine Script scripting are built specifically for this use case.
TradingView for Beginners — Good
The free plan is a legitimate starting point, but the volume of available tools can be overwhelming without a focused learning plan.
TradingView for Active Traders — Good
Premium’s higher alert and connection limits support an active workflow, though execution still depends on a connected or separate broker.
8. TradingView Free vs. Paid
The free Basic plan genuinely lets you chart any supported market, add a couple of indicators, run limited alerts, and use paper trading — with no credit card required. What it doesn’t offer: more than one chart at a time, more than 2 indicators per chart, more than 3 price alerts, and it shows ads.
Paid plans unlock more charts per tab, more indicators per chart, far higher alert limits, Bar Replay, and (from Premium up) watchlist alerts. Upgrading makes sense the moment a specific limit — usually alert count or number of simultaneous charts — is actually blocking your workflow, not simply because a higher tier exists.
Is TradingView Premium actually worth it? For full-time or highly active traders who need dozens of active alerts and multiple simultaneous chart connections, yes. For a casual investor checking a handful of positions a few times a week, Essential or even the free plan is very likely enough, and Premium’s added cost won’t translate into proportionally better decision-making.
9. TradingView Technical Analysis
TradingView supports the full standard technical-analysis toolkit: candlestick charts, moving averages, RSI, MACD, support and resistance drawing tools, trendlines, and multiple timeframes, alongside hundreds of community-built custom indicators.
These tools are decision-support aids, not prediction machines. An RSI reading or a moving-average crossover can highlight a pattern worth investigating further — it does not forecast future price movement with certainty. Building [INTERNAL LINK: chasing signals instead of sticking to a plan] into a habit of confirming signals across multiple indicators and timeframes, rather than acting on any single tool in isolation, is generally considered sounder practice than treating one indicator as a guaranteed signal.
10. TradingView Paper Trading
Paper trading lets you place simulated trades using fake funds while watching how real market prices move. It’s available across TradingView’s plans and is a genuinely useful way for beginners to test a strategy or get comfortable with the platform’s trading interface before committing real money.
The key limitation: paper trading doesn’t fully replicate live trading. It typically doesn’t account for slippage, real order execution delays, or the emotional pressure of risking actual capital, so strong paper-trading results don’t guarantee similar performance once real money and real psychology are involved. Treat it as a learning tool, not a performance guarantee.
11. TradingView Alerts and Watchlists
Price alerts and technical alerts notify you when a symbol hits a specific level or when an indicator condition triggers, which reduces the need to stare at charts throughout the day. Watchlists let you group and monitor symbols you care about in one place, with higher-tier plans supporting far more symbols per watchlist.
Used well, alerts and watchlists support a structured, scheduled approach to checking markets instead of constant, anxious monitoring. It’s worth being clear, though: an alert firing is a prompt to go look at something — not an automatic buy or sell signal on its own.
12. TradingView Alternatives
| Platform | Best For | Charting | Ease of Use | Pricing | Biggest Advantage |
|---|---|---|---|---|---|
| TradingView | All-around charting and technical analysis | Excellent | High | Free–$239.95/mo | Best combination of charting depth and community |
| Investing.com | Casual investors wanting news + basic charts | Good | High | Free–low cost | Strong news and calendar integration |
| TrendSpider | Automated technical analysis and pattern detection | Very good | Medium | Mid–high | Automation-focused analysis tools |
| MetaTrader (4/5) | Forex and CFD execution | Good | Medium | Often free via broker | Deep integration with forex/CFD brokers |
| Thinkorswim | U.S. options and active stock trading (where available) | Very good | Medium | Free with qualifying broker account | Strong options analysis tools |
There’s no single “best” alternative — TradingView leads on charting depth and cross-asset coverage, MetaTrader leads for forex execution, TrendSpider leads for automated pattern scanning, and Thinkorswim leads for U.S. options traders who already have a qualifying brokerage account.
13. Who Should Use TradingView?
- Investors who want charting clearly better than what most brokerage apps offer
- Technical analysts who rely on indicators and drawing tools regularly
- Traders monitoring multiple markets or asset classes at once
- Beginners who want to learn market analysis using paper trading
- Users who want synced chart access across web, desktop, and mobile
- Advanced users who want to build custom indicators with Pine Script
14. Who Should NOT Use TradingView?
- Completely passive long-term investors who rarely, if ever, look at charts
- People who only want basic portfolio tracking, not technical analysis
- Users on an extremely limited budget who don’t need premium charting features
- Beginners who feel overwhelmed by the sheer number of available tools before developing a focused approach
- Traders whose specific broker or data needs aren’t supported on the platform
15. TradingView Review 2026: Final Verdict
Is TradingView worth it in 2026? For anyone doing regular technical analysis across stocks, crypto, or forex, yes — this TradingView review 2026 found the charting and indicator depth to be genuinely best-in-class. For passive investors who rarely check charts, the free plan (or no TradingView at all) is the more sensible choice.
- Ease of use: 4.3/5
- Charting: 4.8/5
- Features: 4.6/5
- Technical analysis: 4.7/5
- Alerts: 4.2/5
- Paper trading: 4/5
- Market coverage: 4.5/5
- Pricing/value: 3.7/5
- Beginner-friendliness: 4/5
- Overall value: 4.4/5
Who should pay for TradingView? Active traders and serious technical analysts who will actually use the higher alert counts, chart limits, and Bar Replay features — the cost is easy to justify when the tools get used daily.
Who should stay on the free plan? Beginners, casual investors, and anyone who checks charts occasionally rather than as part of a daily workflow. There’s no reason to pay before a specific limit gets in the way.
Who should consider an alternative? Forex-focused traders who need deep broker execution integration, or anyone whose specific data/broker combination isn’t supported may be better served by MetaTrader or a broker-native platform instead.
Whatever plan you land on, treat TradingView as one input into [INTERNAL LINK: a repeatable wealth-building system] — the software sharpens your analysis, but it doesn’t replace a disciplined process.